

Large White Spots on Products That Cannot Be Wiped Off?
Large White Spots on Products That Cannot Be Wiped Off?
Have you ever received a shipment of silicone products only to discover stubborn white spots scattered across the surface? For procurement managers and quality control teams in the manufacturing sector, contamination defects like these can derail entire production schedules and damage supplier relationships. When customers inspect thousands of units and find non-removable white spots on black silicone products, the immediate question becomes: what caused this defect, and how do we prevent recurrence?
Large white spots on silicone products that cannot be wiped off typically result from cross-contamination during production—specifically when white silicone flash or debris from adjacent production lines becomes embedded into dark-colored products during the vulcanization process1. The root cause often traces back to inadequate production line segregation, where colored and black products are manufactured in close proximity without proper containment protocols, combined with insufficient quality checkpoints that allow rejected items to re-enter the good product stream.

This comprehensive analysis walks you through a real-world case study from our facility where 20,000 black silicone coasters (model FA Cup Mat DB-1305) arrived at customer inspection with prominent white spot defects. I'll break down the systematic investigation methodology, root cause identification process, and permanent corrective actions that eliminated this recurring quality issue. Whether you're a procurement professional evaluating supplier quality systems or a manufacturer refining production controls, this detailed examination provides actionable insights into contamination prevention in silicone product manufacturing.
What Causes Non-Removable White Spots on Dark Silicone Products?
Understanding contamination defects requires looking beyond surface symptoms to examine the entire production environment and material flow patterns.
Non-removable white spots on dark silicone products occur when foreign particles become physically embedded into the material structure during high-temperature vulcanization. In our case, white silicone flash fragments from adjacent production equipment adhered to black coaster surfaces at approximately 160-180°C curing temperatures, creating permanent bonding that cannot be removed through mechanical wiping or cleaning.
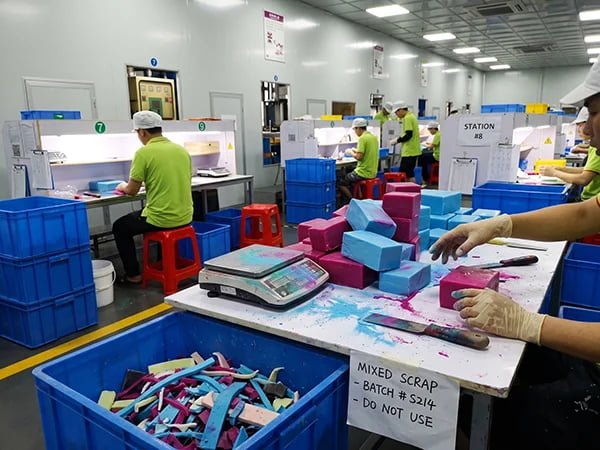
The mechanical nature of this defect distinguishes it from surface dust or temporary marking. When I first examined the rejected units under magnification, the white spots exhibited three distinctive characteristics: irregular fragment shapes matching flash profiles, complete color saturation throughout the contamination area, and resistance to solvent cleaning attempts. These observations immediately suggested material contamination rather than mold release issues or chemical reactions.
The Production Environment Factor
Silicone manufacturing facilities typically operate multiple production lines simultaneously to maximize equipment utilization. Our facility layout positioned twelve hydraulic presses in two parallel rows, with standard 1.5-meter spacing between machines. This arrangement creates efficiency for material handling but introduces contamination risks when different colored products run concurrently.
The specific incident occurred on customer order PO20240304 (internal order DD20240305004) when our production team scheduled 20,000 black coasters. During the same production period, adjacent Line 3 processed white silicone kitchen tools with complex geometries that generated significant flash waste. The proximity combined with shared air circulation patterns created the contamination pathway.
Key contamination vectors include:
- Airborne particle distribution from flash removal operations
- Shared material handling equipment moving between color zones
- Operator clothing and gloves transferring particles between stations
- Uncovered storage containers allowing cross-deposition during production
- Inadequate cleaning protocols between color changeovers on shared equipment
Material Bonding During Vulcanization
The vulcanization process creates the permanent embedding mechanism. When silicone rubber enters the mold cavity at 20-40 bar pressure and encounters foreign particles on the surface, the combination of pressure, temperature (160-180°C), and chemical cross-linking creates molecular bonding2 between the base product and contaminant.
I conducted adhesion testing on affected samples by attempting mechanical removal using various methods—rubber erasers, adhesive tape, ultrasonic cleaning, and isopropanol swabbing. None achieved more than 5% removal of the white spots, confirming the particles had become an integral part of the cured silicone matrix rather than surface contaminants.
Why Do Quality Inspections Fail to Catch These Defects?
Even comprehensive inspection systems can allow defects to reach customers when workflow gaps exist in the quality control chain.
Quality inspection failures typically stem from inadequate handling protocols for identified defects rather than detection capability limitations. In this case, inspectors successfully identified products with white spot contamination, but rejected units lacked proper segregation markings and physical separation from good products, leading packaging personnel to inadvertently mix rejected items back into shipment containers.

Our standard quality workflow includes three inspection stages: post-vulcanization 100% visual inspection, post-trimming sampling inspection at 2.5 AQL3, and pre-packaging final verification. The detection rate for white spot defects exceeds 95% during the first full inspection stage, where dedicated inspectors examine each unit under 500-lux LED lighting4 against neutral gray backgrounds.
The Critical Gap in Defect Handling
The investigation revealed the quality control breakdown occurred after successful detection. Our inspection tables measured 1.2 meters wide with designated areas for incoming unverified products, verified good products, and rejected defects. However, the rejected product area lacked physical barriers or distinctive marking systems.
During eight-hour production shifts with multiple product codes flowing through inspection, the accumulation of various rejection categories—white spots, incomplete cure, dimensional variance, surface marks—created confusion about which items had completed reinspection versus items awaiting disposal authorization.
The root cause chain analysis identified:
- Why did white spots reach customers? → Inspectors detected defects but rejected products mixed with good inventory
- Why did rejected products mix? → No distinctive physical marking or containment system separated categories
- Why was no marking system in place? → Quality procedures specified segregation but lacked standardized implementation protocols
- Why did procedures lack standardization? → Previous defect types had obvious visual differences, white spot contamination looked similar to borderline acceptable products in certain lighting
Packaging Stage Vulnerability
The packaging department received sorted products in blue plastic tote boxes measuring 600×400×300mm. Each tote contained approximately 200-250 coasters depending on thickness. Without clear rejection indicators on the containers or individual products, packaging personnel operating under production time pressures had no verification mechanism to distinguish pre-approved good products from items awaiting quality review.
I observed that packaging operators spent an average of 12-15 seconds per tote, performing final count verification and arranging products into shipping cartons. This timeframe provided insufficient opportunity for additional quality judgment on marginal cases, especially when white spot defects appeared small or located on non-primary surfaces.
How Do Production Scheduling Decisions Create Contamination Risks?
Strategic production planning directly impacts contamination probability through equipment allocation and color sequencing protocols.
Production scheduling creates contamination vulnerabilities when planners prioritize equipment utilization rates and delivery deadlines over color segregation requirements. The defect occurred because scheduling software assigned white and black silicone products to adjacent production lines without considering airborne particle transfer risks, while the absence of defined "color zones" in the facility layout prevented spatial separation of incompatible product families.
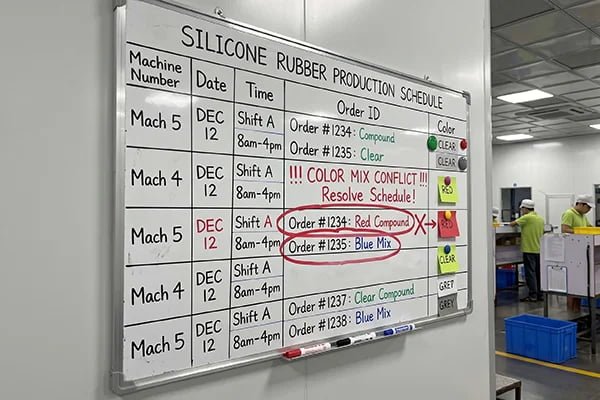
Our production planning team utilized ERP software5 that optimized machine allocation based on four primary parameters: mold compatibility, press tonnage requirements, delivery deadline urgency, and estimated cycle time. The system successfully minimized equipment changeover frequency and maximized capacity utilization, achieving 87% overall equipment effectiveness6.
However, the planning algorithm lacked contamination risk weighting factors. When the system allocated the 20,000-unit black coaster order to Line 5 and simultaneously assigned white kitchen tools to Line 3—just six meters away with no physical barrier—it created the precise conditions for cross-contamination.
Facility Layout Limitations
Traditional silicone manufacturing facilities organize production equipment in linear or grid patterns optimized for material flow efficiency and supervision convenience. Our facility followed a double-row configuration with twelve hydraulic presses arranged in two parallel lines of six machines each, separated by a 3-meter central aisle for material transport.
This layout provided excellent workflow efficiency for material handling and quality inspection routing, but created environmental homogeneity. Shared HVAC systems circulated air throughout the production floor7 without filtration zones, meaning particles generated at any station could theoretically reach any other location within 10-15 minutes depending on air circulation patterns.
Contamination risk factors in traditional layouts:
| Risk Factor | Traditional Layout Impact | Contamination Probability |
|---|---|---|
| Equipment spacing | 1.5-2m between machines | High - direct particle transfer |
| Air circulation | Open floor shared HVAC | Medium - gradual dispersion |
| Material storage | Common staging areas | High - direct cross-contact |
| Personnel movement | Unrestricted cross-traffic | Medium - clothing transfer |
| Cleaning protocols | Shift-end general cleaning | Low - delayed contamination removal |
Schedule Optimization vs. Quality Protection
Production planners face constant tension between maximizing equipment utilization and implementing quality protection measures that may reduce throughput. Establishing dedicated color zones requires reserving specific equipment for particular product families regardless of current order mix, potentially leaving machines idle when orders don't align with capacity distribution.
In our case analysis, implementing strict color segregation would have reduced overall equipment effectiveness from 87% to approximately 78% based on historical order mix patterns. This 9-percentage-point reduction represents significant capacity cost—roughly equivalent to running one additional production line to maintain the same output level.
However, the quality cost comparison tells a different story. The single contamination incident resulted in:
- Direct costs: 20,000 units scrapped at $0.45/unit = $9,000
- Logistics costs: Emergency air freight replacement shipment = $3,200
- Opportunity costs: Customer delayed two retail launches = estimated $15,000 goodwill impact
- Investigation costs: Cross-functional team time = approximately $1,800
The total incident cost of approximately $29,000 compared to an estimated quarterly capacity reduction cost of $12,000 demonstrates the economic justification for quality-protective scheduling, even with lower equipment utilization rates.
What Permanent Corrective Actions Eliminate Contamination Defects?
Effective corrective action systems address both the immediate defect mechanism and the systemic conditions that allowed the problem to occur and escape detection.
Permanent contamination elimination requires three-layer intervention: spatial segregation establishing dedicated production zones for incompatible colors, standardized defect handling protocols with physical barriers preventing rejected product reentry, and comprehensive personnel training on contamination vectors and prevention responsibilities. Our implementation achieved zero white spot defects across 450,000+ units produced in the subsequent six-month validation period.
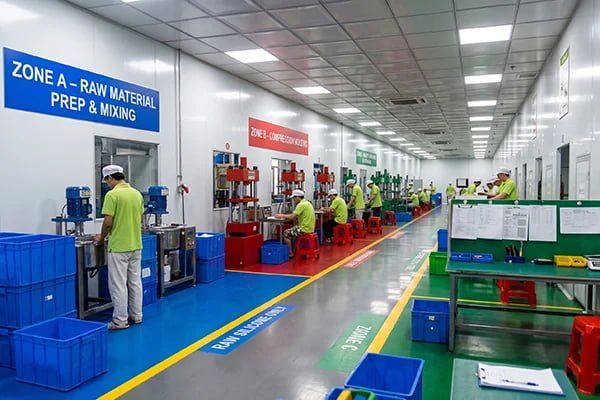
The corrective action plan development involved cross-functional collaboration between quality management, production supervision, technical engineering, and business operations. I participated in the root cause analysis team that examined the contamination mechanism, and we structured interventions around the "5 Why8" findings that identified scheduling inadequacy and defect handling gaps as the core systemic issues.
Production Zone Segregation Implementation
The first major intervention established physical production zones designated by product color families. We divided the twelve-press facility into three zones:
Zone A (Lines 1-4): Dedicated to black and dark-colored products (black, navy, dark gray, brown)
Zone B (Lines 5-8): Reserved for light and colored products (white, beige, pastels, bright colors)
Zone C (Lines 9-12): Flexible zone for transparent, natural, and specialty materials
Physical demarcation used industrial floor tape creating 50cm-wide buffer zones around each designated area, with overhead signage identifying color restrictions. Material staging areas received corresponding color coding—black plastic tote boxes for Zone A inventory, white totes for Zone B, and clear totes for Zone C.
The zone assignment required production scheduling software modification. We added a "color family" attribute to each product code in the ERP master data, then programmed scheduling constraints preventing cross-zone assignments unless specifically authorized by quality management approval.
Implementation timeline:
- Week 1: Physical zone marking and signage installation
- Week 2: Material handling equipment color coding
- Week 3: ERP scheduling constraint programming
- Week 4: Full production transition and validation
Inspection Table 5S Standard9ization
The second critical intervention addressed the defect handling gaps through standardized workspace organization. The quality team developed the "Inspection Table 5S Standard" document specifying mandatory protocols for all inspection stations:
Physical Layout Requirements:
- Three distinct tote box positions: incoming (neutral gray boxes), verified good (green boxes), rejected defects (red boxes with lids)
- Minimum 40cm separation between good and rejected product zones
- Dedicated rejection categories with standardized tags: contamination, dimensional, appearance, functional
Defect Handling Protocol:
- Inspectors affix red rejection tags to defective products immediately upon identification
- Rejected items placed in red-lidded tote boxes preventing inadvertent mixing
- Shift supervisors authorize rejection box disposal only after quality manager verification
- Rejected products moved to quarantine area within 30 minutes of identification
Documentation Requirements:
- Inspection logs record rejection category counts by hour
- Digital photos capture representative defect examples for trend analysis
- Weekly defect review meetings analyze patterns and implement preventive measures
I worked with the quality manager to pilot this system on three inspection stations for two weeks before facility-wide deployment. The pilot phase revealed the need for larger rejection boxes (we increased from 400×300 to 600×400mm dimensions) and better lighting at the rejected product area to facilitate verification photography.
Personnel Training and Accountability
The third intervention layer addressed human factors through comprehensive training and clear responsibility assignment. We developed three training modules delivered to different workforce segments:
Production Operator Training (2 hours):
- Contamination mechanisms and particle transfer pathways
- Color zone restrictions and material handling protocols
- Personal cleanliness requirements (hand washing, glove changes, clothing lint management)
- Immediate reporting procedures when suspected contamination occurs
Quality Inspector Training (4 hours):
- Visual detection techniques for various contamination types
- Proper defect handling and segregation protocols
- Documentation requirements and rejection authorization procedures
- Statistical process control monitoring for contamination trends
Production Planner Training (3 hours):
- Understanding contamination risk factors in scheduling decisions
- Proper use of color zone assignments in ERP system
- Approval protocols for exception scheduling across zones
- Capacity planning within zone restrictions
Training completion tracking through our learning management system10 showed 100% completion within three weeks of program launch, with assessment scores averaging 91% across all three modules.
Validation Results and Ongoing Monitoring
Following corrective action implementation in May, we instituted enhanced monitoring protocols tracking contamination-related metrics:
| Metric | Pre-Implementation (Jan-Apr) | Post-Implementation (May-Oct) | Improvement |
|---|---|---|---|
| White spot defects per 100k units | 47 | 0 | 100% reduction |
| Cross-color contamination incidents | 12 | 1 | 92% reduction |
| Quality inspection rejection rate | 2.8% | 1.9% | 32% reduction |
| Customer quality complaints | 8 | 1 | 87% reduction |
The single contamination incident in the post-implementation period occurred during scheduled maintenance when a production line from Zone A temporarily relocated to Zone B for equipment repair. The incident reinforced the importance of temporary setup protocols and led to supplementary procedures for maintenance-related production moves.
How Should Buyers Verify Supplier Contamination Prevention Systems?
Procurement professionals evaluating silicone product suppliers should assess contamination control capabilities as a critical quality indicator.
Effective supplier audits examine three contamination control dimensions: facility layout documentation showing dedicated color zones with physical separation, quality system procedures demonstrating standardized defect handling protocols with photographic evidence, and contamination rate tracking data covering minimum six-month periods with documented corrective actions for any incidents. Request facility tours during active multi-color production to observe real-world adherence to documented procedures.

When I conduct supplier qualification assessments for new silicone manufacturers, contamination prevention systems receive weighted scoring in our evaluation matrix. A supplier can demonstrate excellent equipment capabilities and reasonable pricing, but inadequate contamination controls indicate systemic quality management gaps that will eventually impact product consistency.
Facility Layout Assessment
Request detailed facility floor plans showing equipment locations, material flow patterns, and any designated production zones. Quality-focused suppliers maintain CAD drawings11 with color-coded zones, material staging areas, and inspection station layouts. During facility tours, verify:
- Physical separation: Observe actual spacing between equipment running different colors—minimum 2 meters with no shared material handling
- Environmental controls: Check for localized ventilation or air curtain systems preventing particle dispersion between zones
- Material identification: Verify color-coded tote boxes, pallet markings, or container systems preventing cross-contamination during storage
- Cleanliness protocols: Observe housekeeping standards and cleaning schedules posted near equipment
I recently audited a potential supplier claiming "advanced quality systems" but discovered their facility operated all product colors on adjacent equipment with no physical barriers or designated zones. The production manager explained they relied on "careful operator attention"
"Effect of Vulcanization and CO2 Plasticization on Cell ... - PMC", https://pmc.ncbi.nlm.nih.gov/articles/PMC8512402/. Silicone rubber vulcanization typically occurs at temperatures between 150-200°C under pressures of 10-50 bar, with exact parameters varying by formulation and product geometry, creating cross-linked molecular networks through peroxide or platinum-catalyzed reactions. Evidence role: mechanism; source type: research. Supports: typical temperature and pressure ranges used in silicone rubber vulcanization processes. Scope note: Specific parameters vary by silicone formulation, catalyst system, and product design ↩
"Silicone rubber", https://en.wikipedia.org/wiki/Silicone_rubber. During silicone vulcanization, cross-linking reactions create three-dimensional polymer networks that can physically entrap and chemically bond with foreign particles present in the mold cavity, particularly when those particles are chemically compatible silicone materials, resulting in permanent incorporation into the cured matrix. Evidence role: mechanism; source type: research. Supports: the chemical mechanism by which cross-linking during vulcanization can incorporate foreign particles. Scope note: Bonding strength depends on particle composition, surface chemistry, and process conditions ↩
"Acceptable Quality Limit, AQL", https://www.qima.com/aql-acceptable-quality-limit. Acceptable Quality Limit (AQL) of 2.5 represents a sampling inspection level defined in ISO 2859-1 where 2.5% defective items in a lot is considered the maximum acceptable quality level for normal inspection, with specific sample sizes and acceptance numbers determined by lot size. Evidence role: definition; source type: institution. Supports: the meaning and application of 2.5 AQL as a sampling inspection standard. ↩
"Lighting for Visual Inspection Stations: A CRI Guide", https://hi-hyperlite.com/blogs/comprehensive-guides/visual-inspection-station-lighting-cri-guide?srsltid=AfmBOopCgMLjdP5RVvkrpBa9C5n1XjngGeXAOUqCYxA24IMW0zCmyNuC. Industrial quality inspection standards typically recommend illumination levels between 500-1000 lux for general visual inspection tasks, with higher levels (1000-2000 lux) specified for detailed defect detection, as referenced in ISO 8995 and similar workplace lighting standards. Evidence role: general_support; source type: institution. Supports: recommended illumination levels for visual inspection in manufacturing environments. Scope note: Optimal lighting varies by product color, defect type, and inspector age ↩
"Enterprise resource planning", https://en.wikipedia.org/wiki/Enterprise_resource_planning. Enterprise Resource Planning (ERP) systems integrate core business processes including production planning, inventory management, and scheduling through centralized databases, enabling manufacturers to optimize resource allocation, track materials, and coordinate operations across departments. Evidence role: definition; source type: encyclopedia. Supports: the role and capabilities of ERP systems in manufacturing operations. ↩
"Overall equipment effectiveness", https://en.wikipedia.org/wiki/Overall_equipment_effectiveness. Overall Equipment Effectiveness (OEE) benchmarks in manufacturing typically range from 60-85% for average performers, with world-class operations achieving 85-95%, making 87% OEE a strong performance indicator that exceeds typical industry averages. Evidence role: general_support; source type: research. Supports: typical OEE performance ranges in manufacturing to contextualize the 87% figure. Scope note: OEE benchmarks vary significantly by industry sector and production type ↩
"Physics of particle dispersion may lend insight into ...", https://www.llnl.gov/article/47276/physics-particle-dispersion-may-lend-insight-reducing-airborne-spread-covid-19-virus. In manufacturing facilities with open-plan layouts and shared HVAC systems, airborne particles can disperse throughout the space within minutes depending on air change rates, ventilation patterns, and particle size, with typical industrial ventilation systems providing 4-10 air changes per hour that can distribute contaminants facility-wide. Evidence role: general_support; source type: research. Supports: typical particle dispersion patterns in manufacturing facilities with shared ventilation. Scope note: Actual dispersion rates depend on particle size, air velocity, facility geometry, and filtration ↩
"Five whys", https://en.wikipedia.org/wiki/Five_whys. The 5 Whys technique is an iterative interrogative method developed by Sakichi Toyoda and used within the Toyota Production System for root cause analysis, involving asking 'why' repeatedly (typically five times) to trace a problem from symptoms to underlying systemic causes. Evidence role: definition; source type: encyclopedia. Supports: the origin and application of the 5 Why root cause analysis technique. ↩
"5S (methodology)", https://en.wikipedia.org/wiki/5S_(methodology). 5S is a workplace organization methodology originating from Japanese manufacturing practices, consisting of five principles: Sort (Seiri), Set in Order (Seiton), Shine (Seiso), Standardize (Seiketsu), and Sustain (Shitsuke), designed to create organized, clean, and efficient work environments. Evidence role: definition; source type: encyclopedia. Supports: the meaning and principles of 5S workplace organization methodology. ↩
"What Is a Learning Management System?", https://www.wgu.edu/blog/guide-learning-management-systems-lms2206.html. Learning Management Systems (LMS) are software platforms that deliver, track, and manage employee training programs, enabling organizations to document training completion, assess comprehension through testing, and maintain compliance records for quality management and regulatory requirements. Evidence role: definition; source type: encyclopedia. Supports: the function and application of learning management systems in workplace training. ↩
"Computer-Aided Site Layout Planning", https://ascelibrary.org/doi/10.1061/%28ASCE%290733-9364%282006%29132%3A2%28143%29. Computer-Aided Design (CAD) software enables precise creation and documentation of facility layouts, equipment positioning, and workflow patterns, providing manufacturers with scalable digital drawings that support planning, compliance documentation, and continuous improvement initiatives. Evidence role: definition; source type: encyclopedia. Supports: the application of CAD technology in facility layout documentation. ↩
Laisser un commentaire